Creating a ggplot with manual legend filled from variables requires the use of the setNames function. This way it is not necessary to duplicate string literals in order to pass mappings to scale_color_manual. A complete code sample followed by explanations demonstrates this solution.
GGPlot of Multiple Time Series with Legend
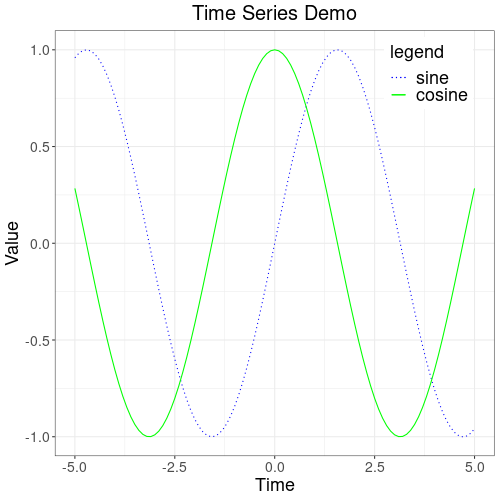
The following sample code produces a plot of two time series with manual legend and line types filled from variables:
# plot multiple time series with legend
# from variables and line types

library(ggplot2)

time <- seq(from=-5,to=5,by=0.1)
sin <- sin(time)
cos <- cos(time)

tdf <- data.frame(cbind(time,sin,cos))

line_sin <- 'sine'
line_cos <- 'cosine'
legend_name <- 'legend'

breaks <- c(line_sin, line_cos)
colors <- c('blue','green')
styles <- c('dotted','solid')

gg <- ggplot(tdf, aes(x=time,y=sin))
gg <- gg + theme_bw()
gg <- gg + labs(title='Time Series Demo',
                x='Time', y='Value')
gg <- gg + theme(plot.title=element_text(hjust=0.5,size=20),
                axis.text=element_text(size=14),
                axis.title=element_text(size=18),
                legend.position=c(0.85,0.9),
                legend.text=element_text(size=18),
                legend.title = element_text(size=18))
gg <- gg + geom_line(aes(color=line_sin,linetype=line_sin))
gg <- gg + geom_line(aes(y=cos,color=line_cos,linetype=line_cos))
gg <- gg + scale_color_manual(name=legend_name,breaks=breaks,
                values=setNames(colors,breaks))
gg <- gg + scale_linetype_manual(name=legend_name,
                values=setNames(styles,breaks))
print(gg)
dev.print(file="time-series.png", device=png,width=500,height=500)
And this is the resulting plot:
Key to the flexible use of variable names for the mapping of colors and line types is the function setNames. Many demos for manual legends duplicate string literals in this manner:
gg <- gg + scale_color_manual(name=legend_name,breaks=breaks,
                values=c('sine'='blue','cosine'='green'))
gg <- gg + scale_linetype_manual(name=legend_name,
                values=c('sine'='dotted','cosine'='solid'))
While the above code works it is much preferable to have the value mappings passed as variables. However, due to an oddity in R variables cannot be passed into the above constructs:
# passing line_sin as a variable will not work!
gg <- gg + scale_color_manual(name=legend_name,breaks=breaks,
              values=c(line_sin='blue','cosine'='green'))
gg <- gg + scale_linetype_manual(name=legend_name,
              values=c(line_sin='dotted','cosine'='solid'))
Instead, setNames allows passing named values to create a ggplot with a manual legend filled from variables:
gg <- gg + scale_color_manual(name=legend_name,breaks=breaks,
                values=setNames(colors,breaks))
gg <- gg + scale_linetype_manual(name=legend_name,
                values=setNames(styles,breaks))
Finally, note it’s essential to pass the same “name=legend_name” to scale_color_manual and scale_linetype_manual. It can be an empty string if you don’t want your legend to have a header. Or even NULL. But it must be set equally or else ggplot places two legends into your graphs.
References
The setNames function: rdocumentation.org